1. Executive Summary
| Category | Value |
| Asset Class | US Futures |
| Product Class | Equity Index |
| Symbol | YM |
| Name | E-mini Dow Jones Industrial Average |
| Model | Pythia-v0.3.0 |
| Date From | 2023-Q1 |
| Date To | 2025-Q4 |
| Signal | Target: Single Contract Prediction Variable: Mid-Price Prediction: Trend Start Window: [Now, now + 5 min] End Window: [15:55, 16:00] ET |
Dow Jones Industrial Average Macro View (2023–2025)
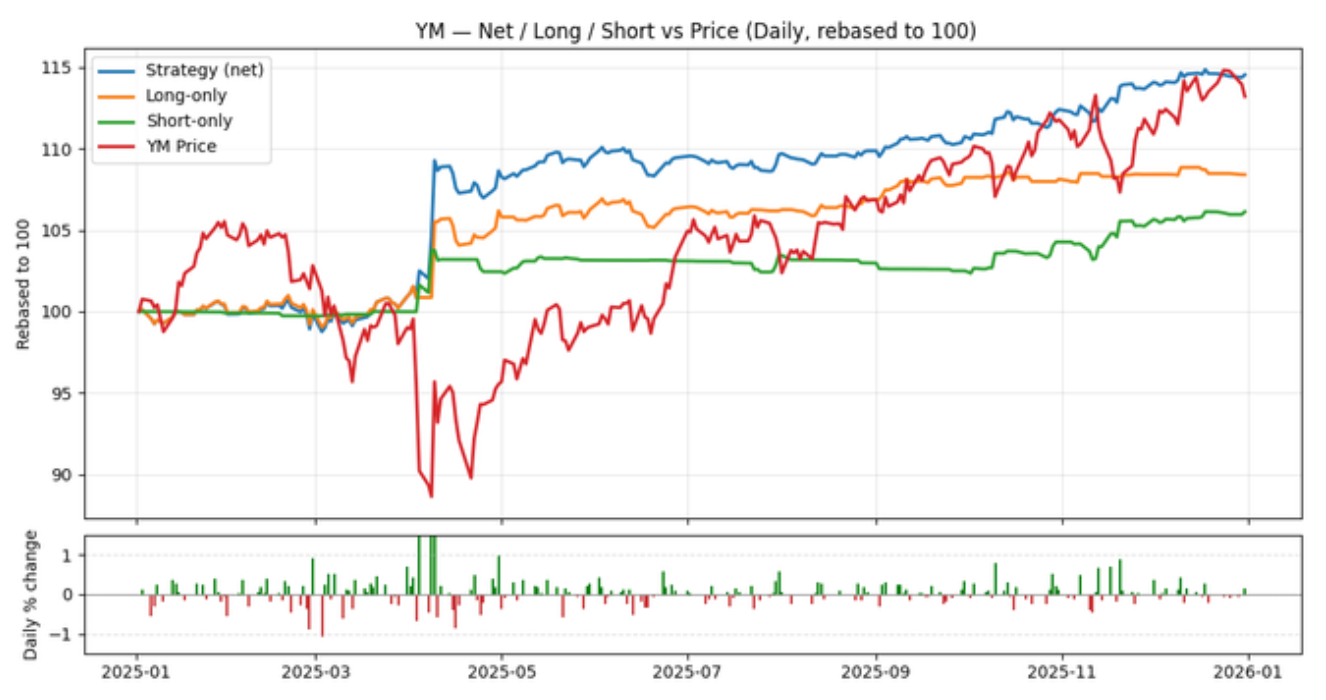
2025: The Dow finished 2025 up approximately +12.7% (price return), marking a third consecutive year of double-digit gains—a feat not seen since the late 1990s. The index delivered a total return of 14.9% including dividends. The year was defined by extreme volatility: Trump's April 2 "Liberation Day" tariffs triggered a two-day loss of over 4,000 points on the Dow (9.48%), followed by the index's best single-day gain since March 2020 (+7.87%) when the 90-day tariff pause was announced. After bottoming on April 8, the S&P 500 rose nearly 40% and remains near all-time highs in early 2026, underscoring how quickly markets can reset when fears ease. Analysts characterized 2025 as a "rotation into old economy value stocks," with industrials like Caterpillar outperforming tech-heavy indices—suggesting a potential regime shift toward blue-chip breadth leadership, though elevated valuations and tariff uncertainty left the market "priced for perfection" heading into 2026.
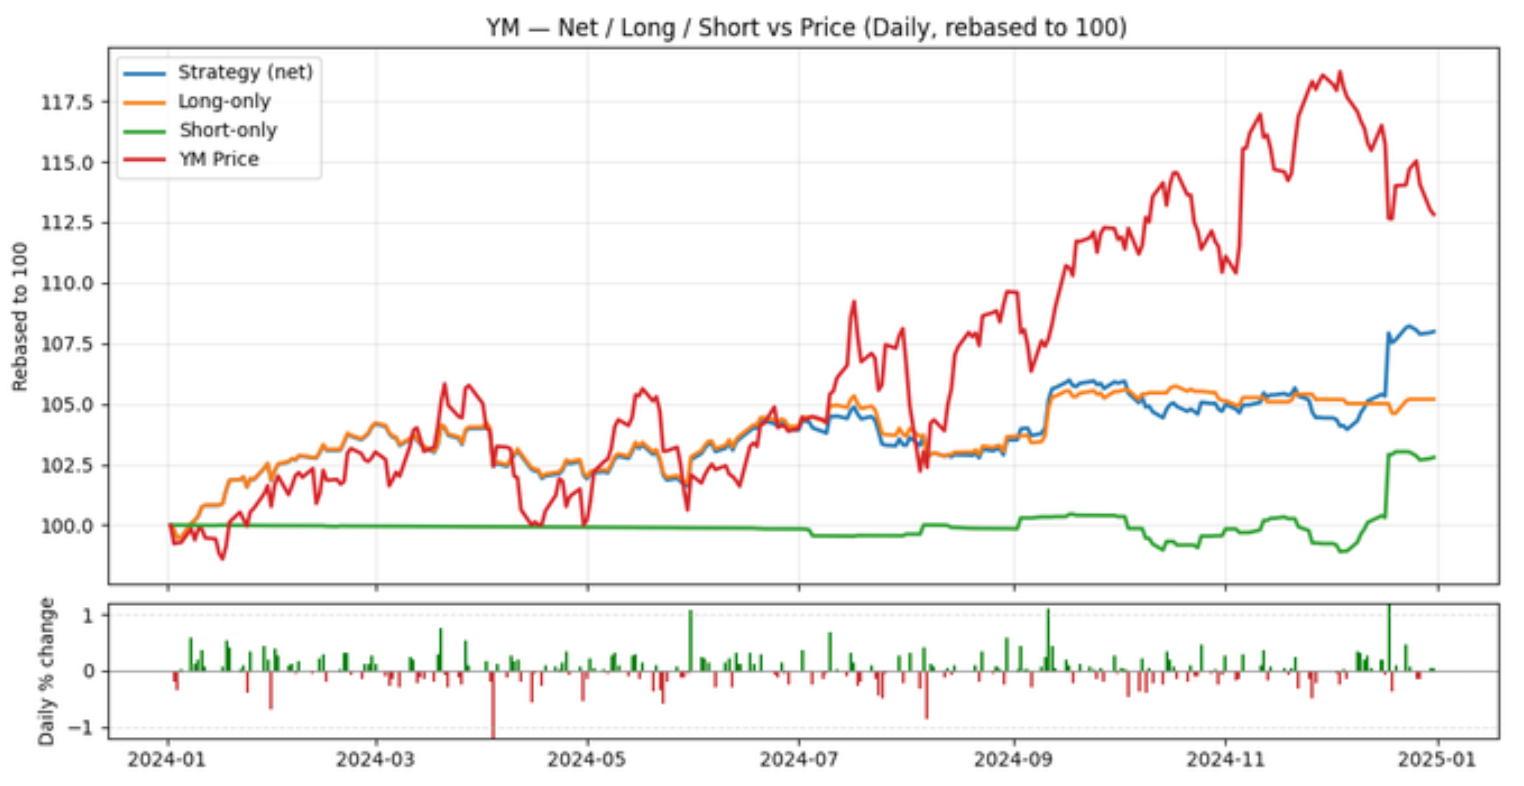
2024: The Dow rose approximately +13% in 2024, soaring 1,507 points (+3.57%) the day after Trump's election victory—the first 1,000+ point single-day gain since November 2022—to close at a new record high. The Federal Reserve cut rates three times during the year, totaling 1 percentage point, offering relief to the economy, though December's hawkish Fed guidance disappointed investors hoping for more aggressive easing. The S&P 500 notched its first back-to-back 20%+ annual returns since the late 1990s, and markets broadly reflected optimism around expected deregulation, tax cut extensions, and pro-business policies under the incoming administration. Strategists viewed 2024 as a continuation of the post-2022 bull market rather than a regime change, with the primary risk being whether elevated valuations could be sustained against "higher-for-longer" rate expectations.
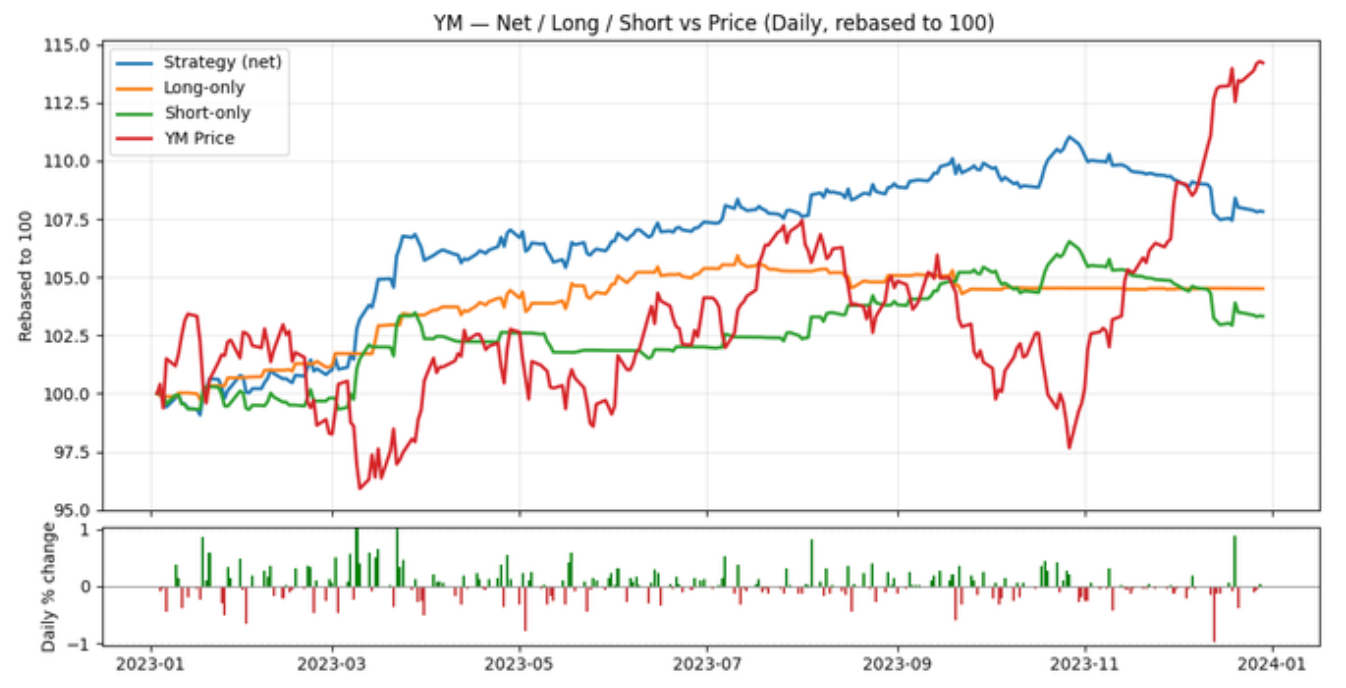
2023: The Dow gained approximately +14% in 2023, recovering from 2022's losses as the widely predicted recession failed to materialize. The March regional-bank shock (Silicon Valley Bank, Signature Bank, First Republic) sparked fears of a full-blown banking crisis and credit crunch, but the Fed's rapid liquidity response allowed confidence to return quickly. The catalyst behind the year-end rally was the Fed's pivot from one of the most aggressive rate hike cycles in history to forecasting multiple rate cuts for 2024. The Dow Jones Industrial Average finished up +16.2% on a total return basis, with a powerful Q4 surge as falling Treasury yields and soft-landing sentiment boosted all sectors. Most analysts framed 2023 as a recovery year rather than a decisive regime shift—the index approached prior highs but leadership remained concentrated in mega-cap tech names (the "Magnificent Seven" phenomenon), leaving questions about whether broader market participation would follow.
Signal Performance Overview:
2025: The Dow Jones signal delivered its strongest year of the three-year window, achieving a Sharpe of 1.80, annualized return of 14.41%, and a Win Rate of 54.87%. Performance was notably uneven across quarters: 25Q2 stood out with an exceptional Sharpe of 2.29 and 37.89% annualized return—likely capturing the sharp V-shaped recovery following the April tariff-induced selloff. However, 25Q1 was the weakest quarter (Sharpe 0.65, MDD -2.54%), suggesting the signal initially struggled to adapt to the pre-tariff chop and early-year uncertainty before re-synchronizing. The strong finish in 25Q4 (Sharpe 2.97, Calmar 12.24) indicates the signal tracked the year-end rally to new highs effectively.
2024: The signal posted solid but more modest results relative to 2025, with a full-year Sharpe of 1.46, annualized return of 7.77%, and Win Rate of 55.58%. The standout was 24Q1 (Sharpe 3.45, Ann. Return 16.93%), which appears to have captured the early-year momentum as markets digested rate-cut expectations. However, 24Q2 was a clear miss—the only quarter with a negative Sharpe (-0.05) and negative return (-0.26%)—consistent with the choppy, range-bound summer tape where the signal struggled to find sustained directional conviction. Performance recovered modestly through H2, though never matching Q1's strength, suggesting the signal tracked the post-election rally but didn't fully monetize the late-year moves.
2023: The signal delivered a respectable full-year profile (Sharpe 1.57, Ann. Return 7.66%, Win Rate 52.97%) but with the widest maximum drawdown of the three-year window (MDD -3.43%). The year was front-loaded: 23Q1 was exceptionally strong (Sharpe 3.13, Ann. Return 24.50%), likely capturing the early-year relief rally after 2022's bear market. 23Q3 also performed well (Sharpe 2.44). However, 23Q4 was a clear miss—negative Sharpe (-1.80), negative return (-6.47%), and the lowest Win Rate of any quarter (44.74%)—indicating the signal was caught offside during the powerful Q4 Fed-pivot rally when the Dow surged to new highs. This late-year lag suggests the signal initially missed the regime shift from "higher-for-longer" to rate-cut expectations.
2. Trading Strategy
In order to produce the metrics below we use the signal in combination with the trading strategy below:
- Leverage: no leverage is applied for this strategy and metrics
- Positions:
- Entry positions: Every 5 minutes (between 09:45 and 15:30 ET) we decide to take a long, short or no position using 1/70 of our starting portfolio for the day (there are 70 possible openings per day).
- Each long/short position is then split into 5 parts and executed on each minute for the next 5 minutes following the decision. There is no sizing adjustment.
- Exit positions: We exit all positions at the end of the day. The exits are split over five minutes (15:55–16:00 ET).
- Costs: 1.5 bp round-turn assumption
- Extra exchange/clearing fees not included.
- Contract series & roll: Front-month continuous. Switch at the open T–5 trading days before expiration—stop trading the expiring contract and start trading the next
3. Model Training Data and Timeframe
Table 1: Quarterly and Annual Metrics
| Category | Value |
| Model Family: | Pythia |
| Version: | v0.3.0 |
| Exchange: | CME Globex |
| Data: | Level II Limit Order Book (10 levels) |
| Training Period: | Q1 2022 - Q4 2024 |
| Retrained Time Period: | Q1 2025 - Q4 2025 |
| Final Validation Period: | Q3 2025 |
4. Performance Metrics
| Quarter | Sharpe | Calmar | Win % | Ann. Return % | Ann. Vol % | MDD % |
| YTD | -0.461 | -0.799 | 53.384 | 0.011 | 3.152 | -1.820 |
| 2025 | 1.801 | 3.945 | 54.867 | 14.410 | 8.002 | -3.653 |
| 25Q4 | 2.974 | 12.239 | 54.559 | 14.404 | 4.843 | -1.177 |
| 25Q3 | 1.444 | 3.822 | 54.167 | 4.292 | 2.972 | -1.123 |
| 25Q2 | 2.286 | 10.378 | 55.700 | 37.891 | 16.575 | -3.651 |
| 25Q1 | 0.647 | 1.489 | 54.731 | 3.788 | 5.850 | -2.543 |
| 2024 | 1.455 | 2.777 | 55.579 | 7.766 | 5.337 | -2.797 |
| 24Q4 | 1.236 | 3.888 | 50.976 | 8.012 | 6.481 | -2.061 |
| 24Q3 | 1.537 | 3.239 | 56.255 | 7.488 | 4.870 | -2.312 |
| 24Q2 | -0.052 | -0.097 | 56.412 | -0.260 | 5.042 | -2.696 |
| 24Q1 | 3.446 | 12.439 | 58.450 | 16.931 | 4.913 | -1.361 |
| 2023 | 1.574 | 2.237 | 52.968 | 7.663 | 4.870 | -3.426 |
| 23Q4 | -1.798 | -1.888 | 44.741 | -6.468 | 3.598 | -3.426 |
| 23Q3 | 2.436 | 8.747 | 53.641 | 9.606 | 3.943 | -1.098 |
| 23Q2 | 1.354 | 3.260 | 58.659 | 5.441 | 4.019 | -1.669 |
| 23Q1 | 3.129 | 13.687 | 55.177 | 24.501 | 7.829 | -1.790 |
| 2023-2025 | 1.604 | 2.631 | 54.447 | 9.822 | 6.124 | -3.734 |
5. Next Steps
Download historical predictions for this month using the Client API and confirm performance in your own test harness:
6. Contact
Please reach out with any questions or comments at: info [at] quantumsignals.ai