1. Executive Summary
NQ Macro Review for February 2026:
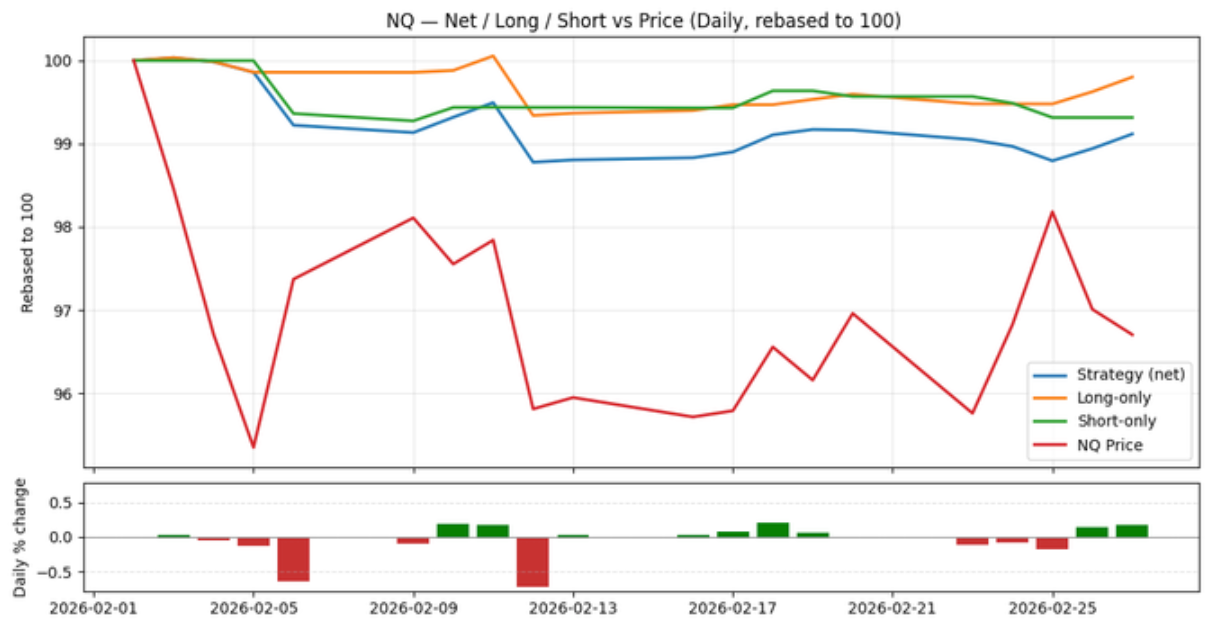
During February 2026, E-mini Nasdaq 100 futures experienced elevated volatility relative to broader equity indices as technology sector valuations continued to respond to interest rate expectations and earnings results from major megacap companies. The index remained heavily influenced by developments in artificial intelligence investment and semiconductor demand, which continued to drive strong momentum in large technology firms. Despite occasional pullbacks triggered by macroeconomic data and Federal Reserve commentary, the overall market regime remained consistent with the technology-led equity rally that began in late 2025.
Signal Performance Overview for February 2026:
During February 2026 the signal experienced a weaker month as increased volatility and frequent short-term reversals in Nasdaq futures reduced the persistence of intraday trends. While the broader technology-driven market remained supportive, rapid shifts in sentiment around macroeconomic data and major earnings releases created a more challenging trading environment. Despite this temporary slowdown, the longer-term performance trend remains solid, suggesting the signal continues to adapt to the evolving dynamics of the NQ market.
2. Trading Strategy
In order to produce the metrics below we use the signal in combination with the trading strategy below:
- Leverage: No leverage is applied for this strategy and metrics
- Positions:
- Entry positions: Every 5 minutes (between 09:45 and 15:30 ET) we decide to take a long, short, or no position using 1/70 of our starting portfolio for the day (there are 70 possible openings per day). Each long/short position is then split into 5 parts and executed on each minute for the next 5 minutes following the decision. There is no sizing adjustment.
- Exit positions: We exit all positions at the end of the day. The exits are split over five minutes (15:55–16:00 ET).
- Costs: 1 bp round-turn assumption (NQ: 1bp ≈ 2 ticks = $25.0). Extra exchange/clearing fees not included.
- Contract series & roll: Front-month continuous. Switch at the open T–5 trading days before expiration—stop trading the expiring contract and start trading the next.
3. Model Training Data and Timeframe
Model Family: Pythia
Version: v0.1.1
Exchange: CME Globex
Data: Level II Limit Order Book (10 levels)
Training Period: Q1 2022 – Q4 2024
Retrained Time Period: Q1 2025 – Q2 2025
Final Validation Period: Q3 2025
4. Performance Metrics
Table 1: Monthly Return and Accuracy Metrics (last 12 months)
| Month | Return (%) | Win Rate (%) |
|---|---|---|
| 2026 Feb | -0.725 | 49.038 |
| 2026 Jan | 1.600 | 59.569 |
| 2025 Dec | 0.444 | 56.146 |
| 2025 Nov | 1.040 | 48.970 |
| 2025 Oct | 0.695 | 49.452 |
| 2025 Sep | 0.907 | 62.755 |
| 2025 Aug | 0.789 | 56.575 |
| 2025 Jul | 0.553 | 52.908 |
| 2025 Jun | 0.547 | 49.310 |
| 2025 May | 0.441 | 48.151 |
| 2025 Apr | 10.605 | 56.335 |
| 2025 Mar | 0.887 | 51.389 |
Table 2: Year over Year Performance Comparison
| Month | Return (%) | Win Rate (%) |
|---|---|---|
| Feb 2026 | -0.725 | 49.038 |
| Feb 2025 | -0.358 | 51.162 |
| Feb 2024 | -0.545 | 47.409 |
Table 3: 12-months ending performance
| Metric | 12 months ending Feb 2026 | 12 months ending Jan 2026 | Change |
|---|---|---|---|
| Sharpe | 2.517 | 2.194 | +0.324 |
| Ann Return (%) | 23.045 | 21.277 | +1.768 |
| Win Rate (%) | 54.455 | 54.582 | -0.128 |
| Max DD (%) | -3.834 | -3.834 | +0.000 |
| Volatility | 9.154 | 9.699 | -0.544 |
| Calmar | 6.010 | 5.549 | +0.461 |
5. Next Steps
1. Start Free Trial: fill out this form
2. API Documentation: https://quantumsignals.ai/documentation
3. Download historical predictions for this month using the Client API and confirm performance in your own test harness.
6. Contact
Please reach out with any questions or comments at: info[at]quantumsignals.ai