1. Executive Summary
| Category | Value |
| Asset Class | US Futures |
| Product Class | Equity Index |
| Symbol | RTY |
| Name | E-mini Russell 2000 |
| Model | Pythia-v0.3.0 |
| Date From | 2023-Q1 |
| Date To | 2025-Q4 |
| Signal | Target: Single Contract Prediction Variable: Mid-Price Prediction: Trend Start Window: [Now, now + 5 min] End Window: [15:55, 16:00] ET |
Russell 2000 Index Macro View (2023–2025)
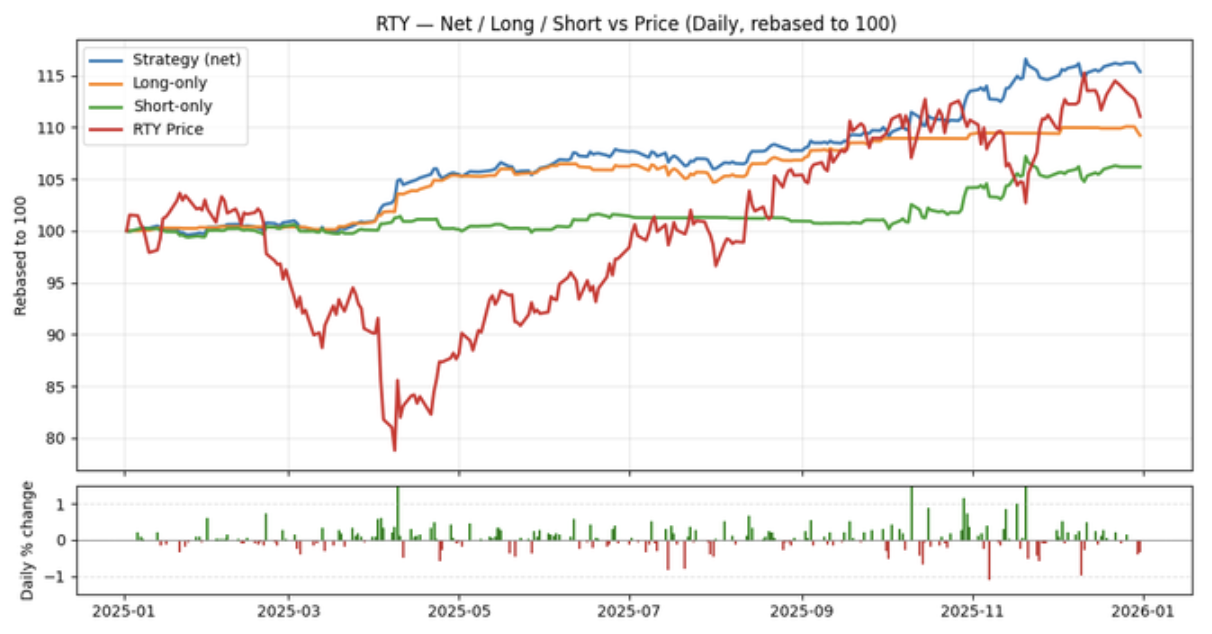
2025: 2025 started unevenly but ended with the Russell 2000 up about +12.8% for the year, powered by a strong rebound off the April 2025 lows as financial conditions improved. (The Royce Funds) After the Fed began cutting in September, the index broke to fresh records (its first since 2021), which fueled more serious talk of a possible regime change toward broader breadth/small-cap leadership—though many strategists emphasized it would only be durable if cuts stayed non-recessionary and inflation didn’t re-accelerate (with tariff/trade headlines and geopolitics key swing risks). (AdvisorHub) By late 2025, the main “extreme” was price-level (back in all-time-high territory after years below the 2021 top), while relative-valuation narratives still leaned on “catch-up vs large caps” rather than outright bubble conditions. (MarketWatch)
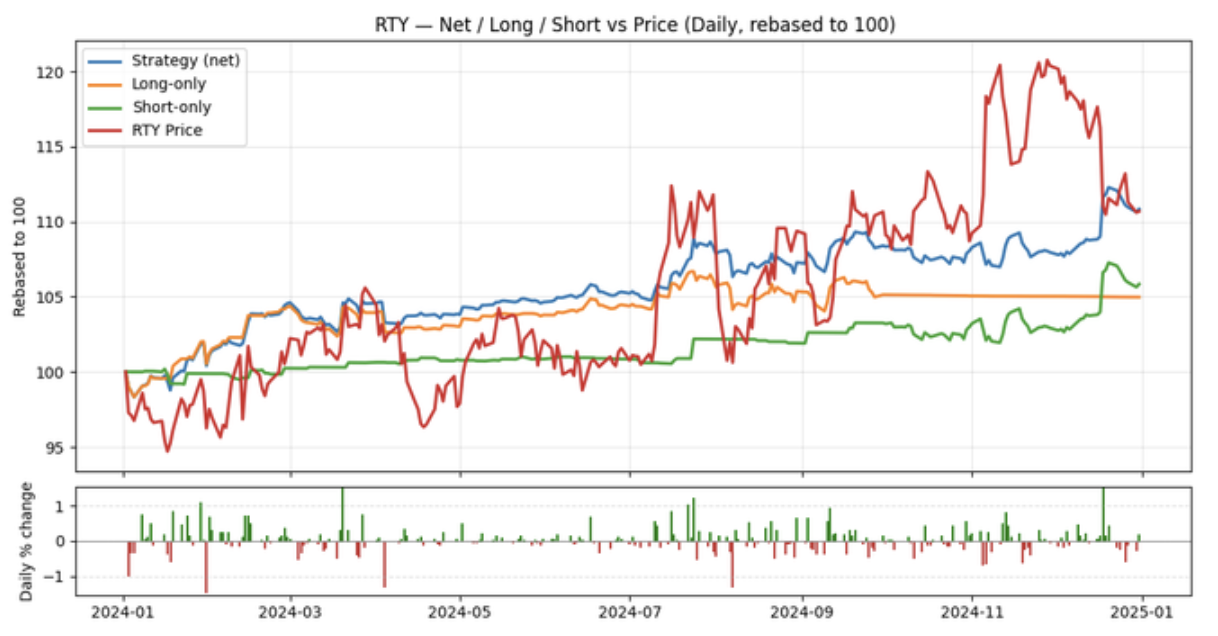
2024: In 2024 the Russell 2000 finished up about +10%, even after a sharp December pullback (~8% from YTD highs)—a reminder that small caps were still trading as a macro/credit-duration proxy. (Cboe Global Markets) The year featured bursts of “rotation” performance (notably early July) as cooling inflation boosted conviction that the Fed would begin cutting, pulling flows into rate-sensitive small caps. (Investopedia) Analysts debated whether this was a leadership regime shift or just episodic rotation; the common view was “not confirmed yet,” with the index not consistently in record territory and needing sustained easing/earnings breadth to validate a new regime. (Investopedia)
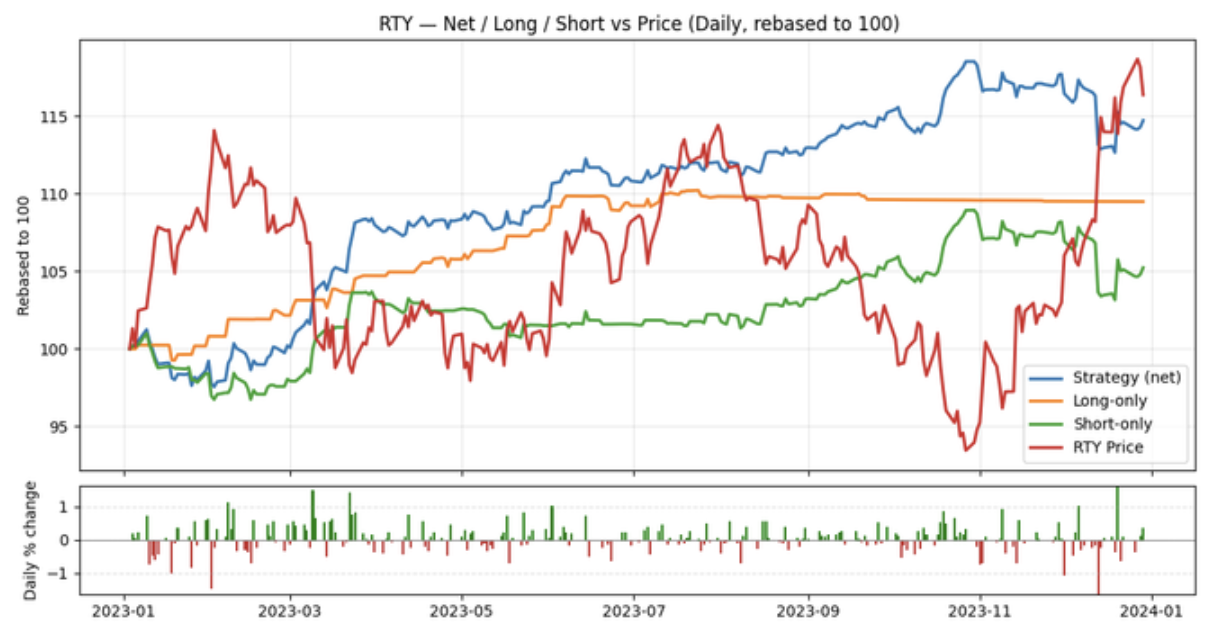
2023: The Russell 2000 rebounded in 2023 (about +16.9%), but the ride was choppy as “higher-for-longer” policy and the March regional-bank shock (SVB/Signature/First Republic) kept small caps more volatile and rate-sensitive than large caps. (Marquette Associates) Geopolitical risk (Russia–Ukraine and the Israel–Hamas war late in the year) contributed to risk-on/risk-off swings, but the dominant driver was shifting inflation and rate expectations. Most strategists framed 2023 as continuation of the post-2022 regime rather than a decisive regime change—small caps finished the year well below the 2021 peak, with positioning/valuation more “catch-up” than “overheated.” (Marquette Associates)
Signal Performance Overview:
2025: Over the last 12 months, the signal showed its best overall regime fit: Sharpe 2.423, Calmar 6.865, Ann. Return 15.24% with the smallest drawdown (MDD -2.22%) and a higher Win% (55.48%). The standout was 25Q2 (Sharpe 4.376, Win% 59.32%), followed by solid Q3–Q4, indicating the signal adapted well as the underlying’s trend/volatility conditions evolved through the year. The main blemish was the deeper 25Q1 drawdown (-3.651%), suggesting a brief period where the signal was slower to align, before re-synchronizing and compounding thereafter.
2024: Relative to the last 12 months (2025), 2024 was noticeably lower gear on risk-adjusted returns (Sharpe 1.514 vs 2.423) and less consistent (Win% 52.53%, MDD -3.88%). The year started strong (24Q1 Sharpe 2.137) but softened meaningfully in 24Q2 (Sharpe 0.769, low return), which is typical of a choppier, rotation-heavy tape that’s harder for trend-following signals to monetize. Overall, it looks like the signal tracked directional moves at times, but missed or diluted portions of the underlying’s mid-year transitions and late-year rotations.
2023: The signal delivered a strong full-year profile (Sharpe 1.730, Ann. Return 14.41%, Win% 54.64%) but with the widest drawdown of the three-year window (MDD -5.41%). Performance was driven by a very strong first three quarters (notably 23Q1–23Q3, with Sharpe up to 3.471), suggesting the signal generally captured the prevailing moves in the underlying. The clear miss was 23Q4 (negative Sharpe -0.257 and negative return), consistent with a late-year shift/rotation where the signal lagged or was briefly positioned the wrong way.
2. Trading Strategy
In order to produce the metrics below we use the signal in combination with the trading strategy below:
- Leverage: no leverage is applied for this strategy and metrics
- Positions:
- Entry positions: Every 5 minutes (between 09:45 and 15:30 ET) we decide to take a long, short or no position using 1/70 of our starting portfolio for the day (there are 70 possible openings per day).
- Each long/short position is then split into 5 parts and executed on each minute for the next 5 minutes following the decision. There is no sizing adjustment.
- Exit positions: We exit all positions at the end of the day. The exits are split over five minutes (15:55–16:00 ET).
- Costs: 2 bp round-turn assumption
- Extra exchange/clearing fees not included.
- Contract series & roll: Front-month continuous. Switch at the open T–5 trading days before expiration—stop trading the expiring contract and start trading the next
3. Model Training Data and Timeframe
Table 1: Quarterly and Annual Metrics
| Category | Value |
| Model Family: | Pythia |
| Version: | v0.3.0 |
| Exchange: | CME Globex |
| Data: | Level II Limit Order Book (10 levels) |
| Training Period: | Q1 2022 - Q4 2024 |
| Retrained Time Period: | Q1 2025 - Q4 2025 |
| Final Validation Period: | Q3 2025 |
4. Performance Metrics
| Quarter | Sharpe | Calmar | Win % | Ann. Return % | Ann. Vol % | MDD % |
| YTD | 2.298 | 6.231 | 56.717 | 2.301 | 14.317 | -2.432 |
| 2025 | 2.423 | 6.865 | 55.481 | 15.239 | 6.290 | -2.220 |
| 25Q4 | 2.275 | 9.939 | 55.797 | 22.063 | 9.696 | -2.220 |
| 25Q3 | 1.833 | 4.442 | 54.923 | 8.680 | 4.736 | -1.954 |
| 25Q2 | 4.376 | 23.009 | 59.323 | 30.264 | 6.917 | -1.315 |
| 25Q1 | 1.926 | 3.344 | 55.139 | 12.211 | 6.340 | -3.651 |
| 2024 | 1.514 | 2.717 | 52.533 | 10.528 | 6.956 | -3.875 |
| 24Q4 | 1.244 | 4.877 | 48.490 | 9.250 | 7.439 | -1.897 |
| 24Q3 | 1.595 | 3.095 | 53.152 | 11.992 | 7.520 | -3.875 |
| 24Q2 | 0.769 | 1.782 | 53.693 | 2.810 | 3.652 | -1.577 |
| 24Q1 | 2.137 | 7.704 | 54.549 | 19.451 | 9.104 | -2.525 |
| 2023 | 1.730 | 2.662 | 54.636 | 14.408 | 8.327 | -5.412 |
| 23Q4 | -0.257 | -0.445 | 51.694 | -2.410 | 9.367 | -5.412 |
| 23Q3 | 3.471 | 12.429 | 58.269 | 16.561 | 4.772 | -1.332 |
| 23Q2 | 2.074 | 5.903 | 51.916 | 12.507 | 6.029 | -2.119 |
| 23Q1 | 2.975 | 7.931 | 56.935 | 35.321 | 11.874 | -4.453 |
| 2023-2025 | 1.835 | 2.324 | 54.223 | 13.257 | 7.226 | -5.705 |
5. Next Steps
Download historical predictions for this month using the Client API and confirm performance in your own test harness:
6. Contact
Please reach out with any questions or comments at: info [at] quantumsignals.ai