1. Executive Summary
ES Macro Review for February 2026:
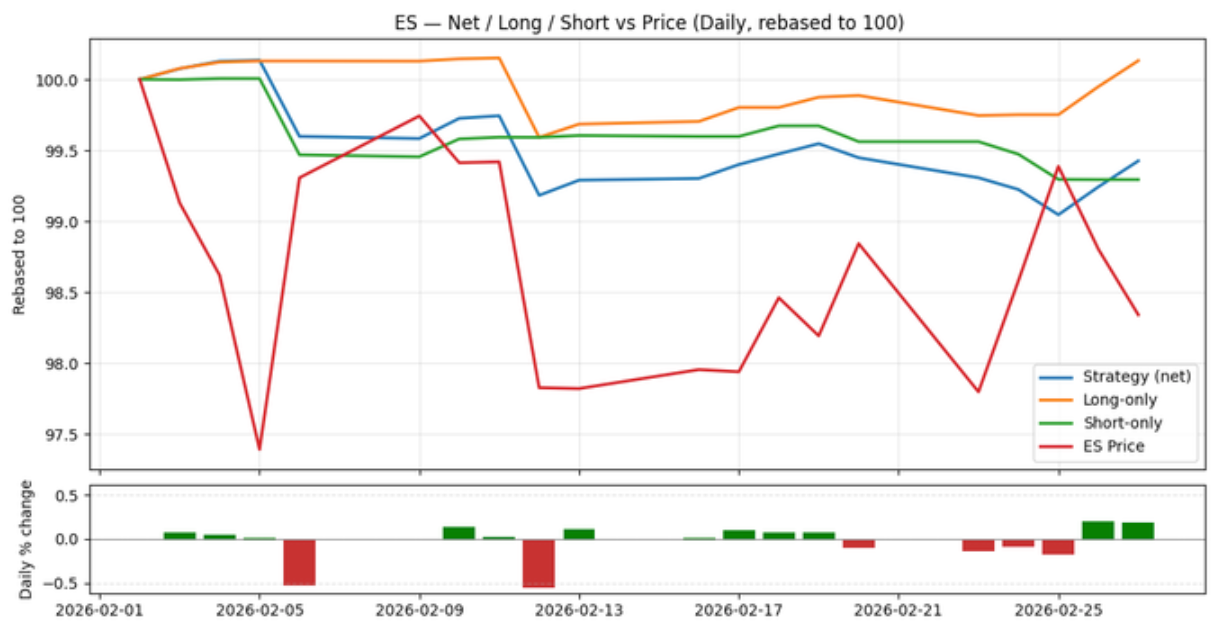
During February 2026, E-mini S&P 500 futures traded within a moderately volatile regime as markets reacted to continued uncertainty around the Federal Reserve rate path and mixed macroeconomic data in the United States. Equity markets remained supported by resilient corporate earnings and strong momentum in large technology companies, although periodic risk-off episodes were triggered by inflation surprises and geopolitical tensions. Overall, analysts view the current market structure as a continuation of the late 2025 risk-on regime rather than a structural regime change, with valuations elevated but not yet at historical extremes.
Signal Performance Overview for February 2026:
During February 2026 the signal experienced a softer month as macro-driven volatility and intermittent risk-off episodes led to more frequent intraday reversals and weaker short-term directional persistence in ES futures. Despite this temporary slowdown, the broader twelve-month performance trend remains stable, suggesting the model continues to adapt to evolving market dynamics and capture intraday opportunities in the market.
2. Trading Strategy
In order to produce the metrics below we use the signal in combination with the trading strategy below:
- Leverage: No leverage is applied for this strategy and metrics
- Positions:
- Entry positions: Every 5 minutes (between 09:45 and 15:30 ET) we decide to take a long, short, or no position using 1/70 of our starting portfolio for the day (there are 70 possible openings per day). Each long/short position is then split into 5 parts and executed on each minute for the next 5 minutes following the decision. There is no sizing adjustment.
- Exit positions: We exit all positions at the end of the day. The exits are split over five minutes (15:55–16:00 ET).
- Costs: 1 bp round-turn assumption (ES: 1bp ≈ 2 ticks = $25.0). Extra exchange/clearing fees not included.
- Contract series & roll: Front-month continuous. Switch at the open T–5 trading days before expiration—stop trading the expiring contract and start trading the next.
3. Model Training Data and Timeframe
Model Family: Pythia
Version: v0.1.1
Exchange: CME Globex
Data: Level II Limit Order Book (10 levels)
Training Period: Q1 2022 – Q4 2024
Retrained Time Period: Q1 2025 – Q2 2025
Final Validation Period: Q3 2025
4. Performance Metrics
Table 1: Monthly Return and Accuracy Metrics (last 12 months)
| Month | Return (%) | Win Rate (%) |
|---|---|---|
| 2026 Feb | -0.548 | 47.124 |
| 2026 Jan | 2.513 | 70.539 |
| 2025 Dec | 0.630 | 57.796 |
| 2025 Nov | 0.355 | 49.794 |
| 2025 Oct | 0.702 | 52.089 |
| 2025 Sep | 0.542 | 56.032 |
| 2025 Aug | 1.306 | 60.934 |
| 2025 Jul | 0.494 | 56.703 |
| 2025 Jun | -0.518 | 48.606 |
| 2025 May | 0.945 | 55.832 |
| 2025 Apr | 4.944 | 52.973 |
| 2025 Mar | 1.648 | 57.807 |
Table 2: Year over Year Performance Comparison
| Month | Return (%) | Win Rate (%) |
|---|---|---|
| Feb 2026 | -0.548 | 47.124 |
| Feb 2025 | 0.559 | 52.937 |
| Feb 2024 | -0.262 | 45.135 |
Table 3: 12-months ending performance
| Metric | 12 months ending Feb 2026 | 12 months ending Jan 2026 | Change |
|---|---|---|---|
| Sharpe | 1.841 | 1.764 | +0.078 |
| Ann Return (%) | 16.413 | 16.395 | +0.018 |
| Win Rate (%) | 55.967 | 56.692 | -0.725 |
| Max DD (%) | -4.374 | -4.373 | -0.001 |
| Volatility | 8.913 | 9.295 | -0.382 |
| Calmar | 3.753 | 3.749 | +0.004 |
5. Next Steps
1. Start Free Trial: fill out this form
2. API Documentation: https://quantumsignals.ai/documentation
3. Download historical predictions for this month using the Client API and confirm performance in your own test harness.
6. Contact
Please reach out with any questions or comments at: info[at]quantumsignals.ai