1. Executive Summary
This is a monthly performance report on the two signals we have published and are now running live (ES & NQ). The results in this report were generated in real-time by our service during the month of January 2026.
One month is not a statistically significant sample to draw broad conclusions. The objective of this report is to keep our audience updated of the signal perofrmance on an on-going basis.
2. Review the Basics
2.1 Data
We use Level II LOB (10 levels, prices & volumes) from CME Globex with ~3 years’ worth of history for training, plus the real-time LOB feed for near-real-time predictions.
2.2 Predictions
For the two pre-trained signals we are reviewing in this document we are predicting the following:
- Target variable: mid-price trend (Up / Down / Stable) between two averaging windows:
- Start window: [now, now + 5 min] (average over next 5-minutes)
- End window: end of the day (average over 15:55–16:00 ET)
- Stable: ±2 bps band around 0
- Prediction cadence: every 1 minute on CME Trading Days for Equities, 09:30–16:00 ET
2.3 AI Model
Current model used: Pythia-v0.1.1-Sep25
We introduced our baseline model Pythia-v0.1.0 in a recent blog post. The “Sep25” suffix corresponds to the last month in the data set used to train, test, and validate the model.
We utilize a Temporal Fusion Transformer (TFT) architecture optimized for market microstructure. This is not an LLM, we use transformer components tailored for finance. Here are some of the key considerations the model takes into account:
- multi-scale time features (LOB events, seconds, minutes, days)
- probability calibration (post-processing of the output using class probabilities)
- cost-sensitive loss function aligned to PnL
Technical paper on TFT: “Temporal Fusion Transformers for Interpretable Multi-horizon Time Series Forecasting”, B. Lim et al (available at https://arxiv.org/abs/1912.09363).
3. Benchmarks
3.1 Training, Validation, and Test periods
We are retraining our models every 3 months, and evaluating performance out-of-sample.
- Training: Several months of historical data that we use to train the model. Every 3 months we append another 3 months of data to the end of this data set.
- Validation: A 3-month period (rolling forward every 3 months), not seen during training, that we use to pick the best performing model.
- Test: A 3-month period (rolling forward every 3 months), not seen during training or validation, that we use to report performance.
3.2 Trading Strategy Used for Benchmarking
Quick review of the trading strategy used:
- Every 5 minutes (between 09:45 and 15:30 ET) we decide to take a long, short or no position using 1/70 of our starting portfolio for the day (there are 70 possible openings per day).
- Each long/short position is then split into 5 parts and executed on each minute for the next 5 minutes following the decision. There is no sizing adjustment.
- We exit all positions at the end of the day again split over five minutes (15:55–16:00 ET).
- Costs: 1 bp round-turn assumption (ES: 1bp ~ 2 ticks = $25.0, NQ: 1bp ~ 8 ticks = $40.0).
- Leverage: no leverage is applied for this strategy and metrics
- Extra exchange/clearing fees not included.
- Contract series & roll: Front-month continuous. Switch at the open T–5 trading days before expiration—stop trading the expiring contract and start trading the next
3.3 Performance Metrics
January 2026
| Symbol | Sharpe | Ann. Return % | Ann. Vol % | Profit Factor | Calmar | MDD % | Win % |
| NQ | 6.308 | 26.4646 | 4.1954 | 2.2131 | 44.0185 | -0.6012 | 61.7214 |
| ES | 7.1704 | 24.295 | 3.3883 | 2.6876 | 60.4314 | -0.402 | 63.8295 |
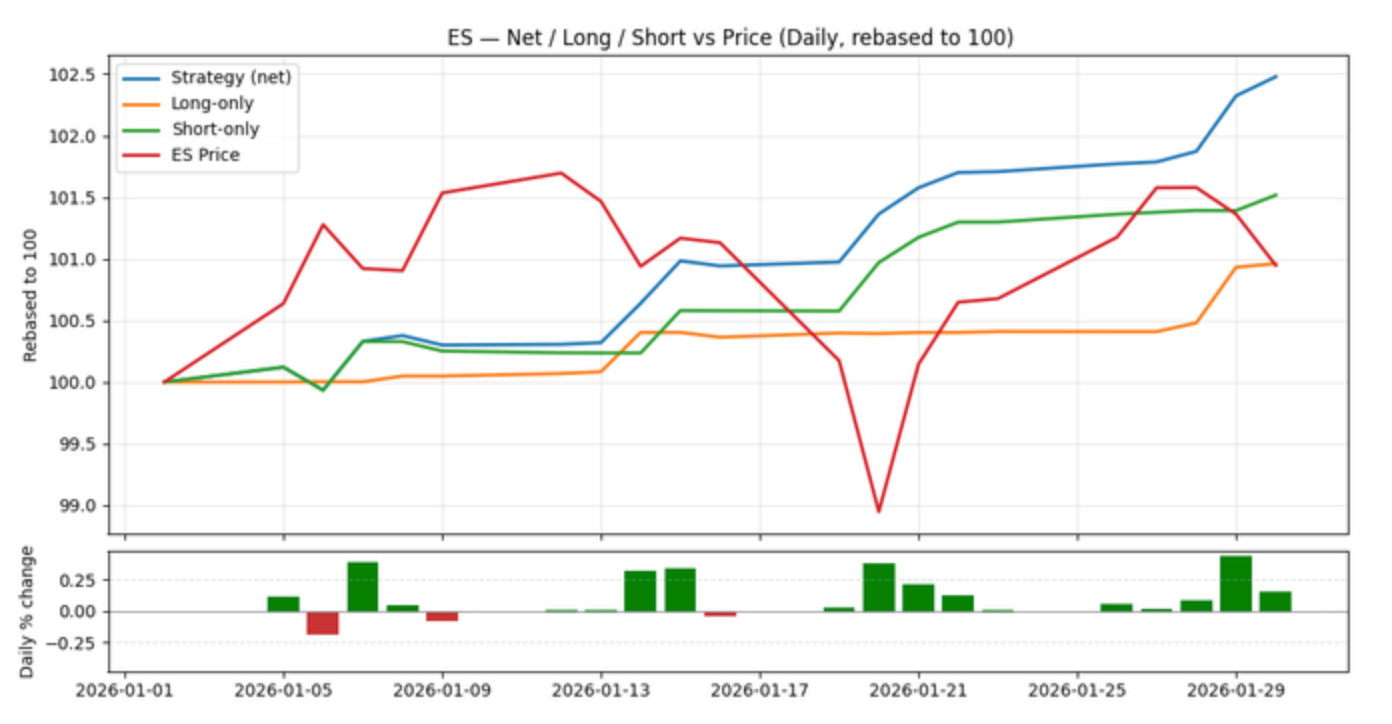
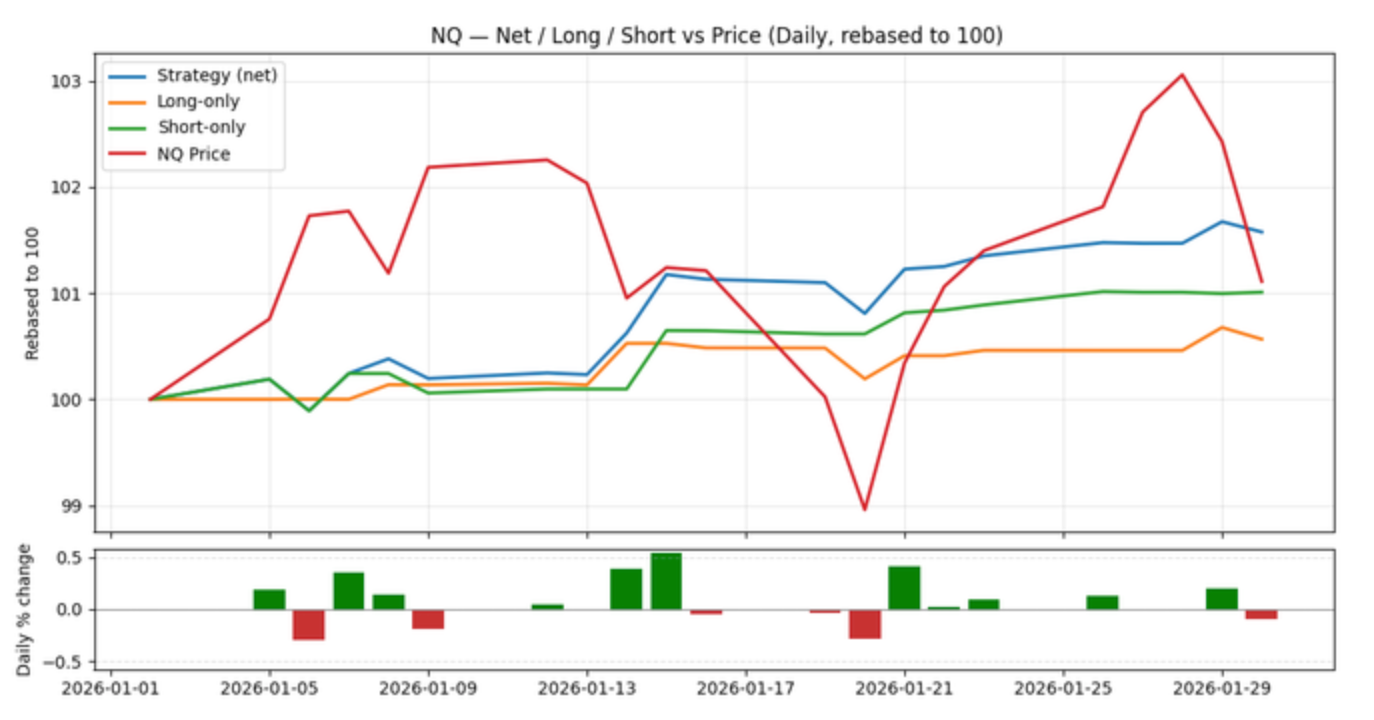
Notes:
- Annualization: daily conversion to annual using √252.
- Sharpe uses daily returns.
- Ann. Vol: Annualized Volatility.
- MDD: Max Drawdown.
- Rebasing: curves rebased to 100 at period start.
4. Historical Prediction Data
The predictions generated by the model are available through our Client API.
5. Next steps
- Download past predictions from the links in Section 4 and test with your own test harness and strategies.
- Review out-of-sample performance by consuming the predictions in real-time using our API. This requires signing-up for our “Professional” tier which includes a 1-month free trial.
- Go beyond pre-trained signals by tailoring a signal to your specific needs. Customize by symbol, target variable, time horizon, neutral band, entry cadence and risk rules.
6. Contact
Yianni Gamvros
Co-founder & CEO
yianni [at] quantumsignals.ai
+ 1 202 390 4935
Disclaimers:
- Futures trading involves substantial risk of loss and is not suitable for all investors.
- Hypothetical/simulated results do not represent actual trading, may under- or over-state market impacts (e.g., liquidity), and reflect hindsight.
- No representation that any account will achieve similar results.
- Past performance is not necessarily indicative of future results.
- Quantum Signals is not an NFA member