Updated April 21, 2026: extended to include market VWAP as a secondary benchmark.
Executive Summary
Quantum Signals produces live direction-to-close signals for highly liquid equities and futures markets. These signals capture persistent intraday market dynamics and can be used as a timing overlay for execution algorithms.
This note presents a simple, transparent benchmark evaluating whether such signals improve the execution of a fixed parent order, applied to E-mini S&P 500 (ES) and E-mini Nasdaq 100 (NQ) futures. We simulate a daily parent order executed using a signal-aware schedule and evaluate its performance against two benchmarks:
- A standard TWAP schedule — a live, fully executable baseline that divides the order evenly across time intervals.
- The market VWAP — the realized volume-weighted average price over the session, included as a theoretical reference. Unlike TWAP, market VWAP cannot be targeted in advance and is only observable after the session close; any live VWAP execution algorithm is an approximation that typically falls short due to volume forecast error and execution friction.
The signal-aware schedule dynamically tilts the execution trajectory earlier or later depending on the signal direction, using an aggressiveness level of λ=1, while always guaranteeing full completion of the parent order by the session close. The simulation assumes zero transaction costs. Since any fixed per-trade cost would apply uniformly to all strategies, it would not affect the relative improvement reported.
Across 2024 and 2025, the signal-aware schedule outperforms TWAP by an average of 2.58 basis points per day across all 32 quarter-symbol-direction combinations tested, with no single quarter showing a negative result and consistent across both order directions. Against the theoretical market VWAP benchmark, the signal-aware schedule also outperforms by the same average of 2.58 basis points per day, with a stronger positive result on short orders and a modest positive result on long orders.
The benchmark isolates the value of predictive timing while keeping the total traded quantity and execution horizon identical across scenarios. The results suggest that intraday direction-to-close signals provide measurable and consistent execution value across instruments, directions, and market regimes. While the benchmark is conducted on ES and NQ futures, the same approach applies directly to correlated instruments including MES, MNQ, SPY, and QQQ.
1. Signal Overview
Quantum Signals provides live direction-to-close signals for highly liquid futures markets, generated by proprietary neural networks based on Temporal Fusion Transformer (TFT) architectures.
The signals are updated each minute. At each update, the model predicts the direction of price movement between the current 5-minute window and the close of the session, defined as:
Average midprice over [15:55, 16:00] − Average midprice over [t, t+5min]
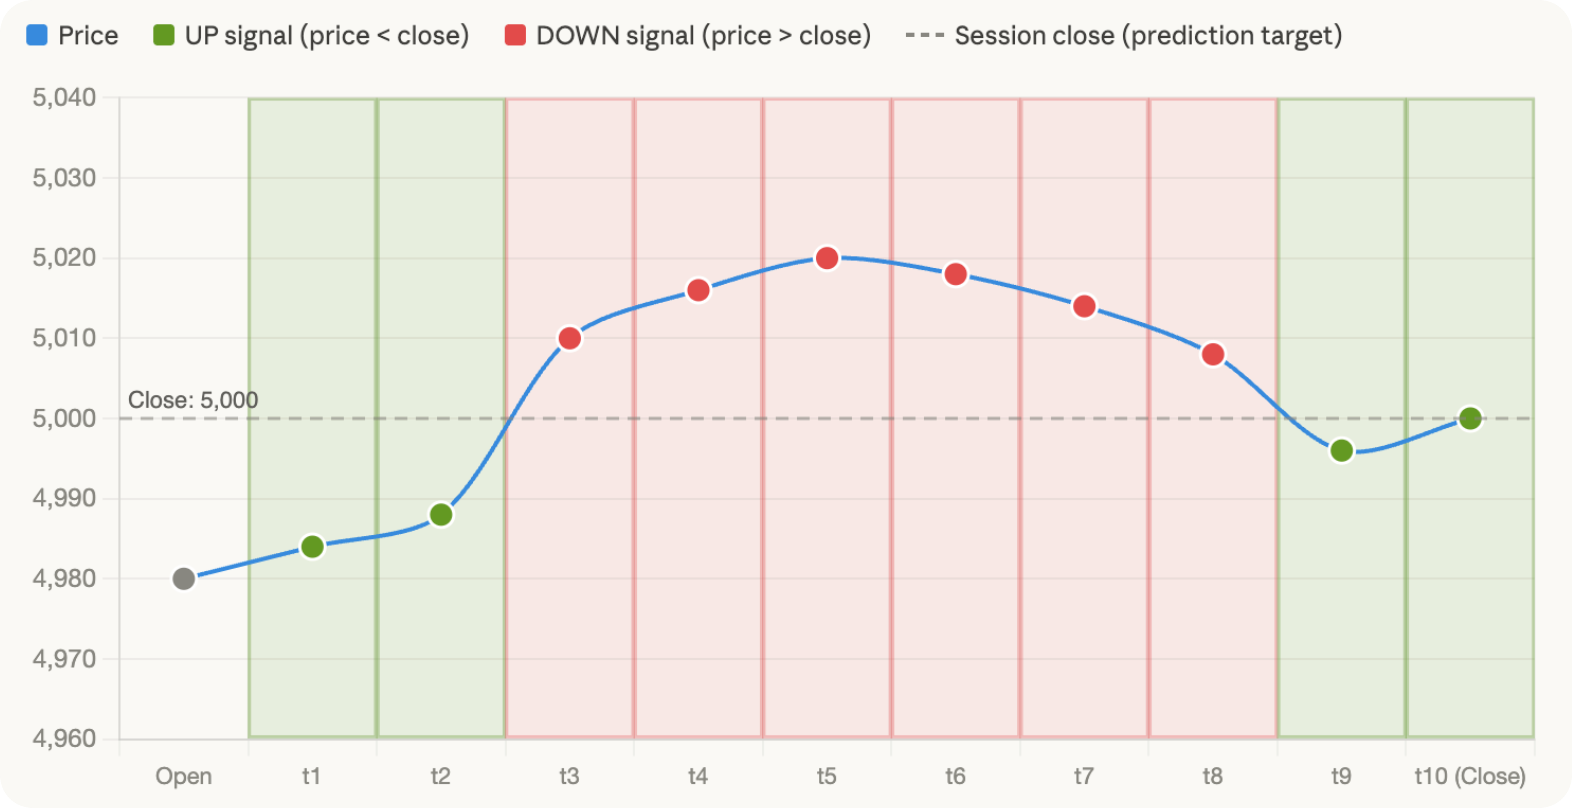
The signal takes three values: UP, STABLE, or DOWN, indicating whether the model expects price to rise, remain broadly flat, or fall between the current moment and the session close.
2. Benchmark Design
To evaluate the execution value of direction-to-close signals, we construct a benchmark comparing a signal-aware execution schedule against two reference benchmarks: a standard TWAP schedule and the market VWAP. TWAP is a live, executable strategy that serves as the primary baseline. Market VWAP — the realized volume-weighted average price over the session — is included as a theoretical reference that represents an upper bound on what any execution algorithm could achieve in hindsight.
The benchmark is conducted on E-mini S&P 500 (ES) and E-mini Nasdaq 100 (NQ) futures over the full years 2024 and 2025. All results are out-of-sample. Buy and sell orders are evaluated separately for each instrument, yielding four instrument-direction combinations, each assessed against both benchmarks.
Each simulation assumes a parent order of Q = 10,000,000 USD notional, executed over regular trading hours from 9:45 to 16:00 ET — a horizon of 374 one-minute intervals. Execution begins at 9:45 rather than the session open to avoid opening volatility and to allow the model sufficient intraday history before generating predictions. The signal-aware schedule dynamically tilts the execution trajectory earlier or later depending on the signal direction, using an aggressiveness level of λ=1, while always guaranteeing full completion of the parent order by the session close. The simulation assumes zero transaction costs. Since any fixed per-trade cost would apply uniformly to both strategies, it would not affect the relative improvement reported.
3. Execution Strategies
3.1 Baseline TWAP
The baseline strategy executes the parent order using a standard Time-Weighted Average Price (TWAP) schedule. The parent order notional Q is converted into a number of units using the session open price P₀:
N = Q / P₀
These units are then divided evenly across the T = 374 one-minute intervals, yielding a constant slice size:
q₀ = N / T
All calculations are performed using fractional units throughout the simulation.
3.2 Market VWAP Reference
The market VWAP for a given session is defined as the volume-weighted average of all trade prices executed during the session:
VWAP = Σ(Pᵗ × Vᵗ) / ΣVᵗ
where Pᵗ and Vᵗ are the price and volume of each trade executed during the session. Market VWAP is computed from exchange tape data and is observable only after session close. It serves as a theoretical upper bound: a perfectly executed VWAP algorithm would achieve exactly this price, but in practice any live implementation will deviate due to volume forecast error, latency, and execution friction. Its inclusion as a secondary benchmark provides a rigorous reference point that contextualises the signal-aware schedule's performance relative to the best achievable outcome in hindsight.
3.3 Signal-Aware Execution Schedule
The signal-aware strategy dynamically adjusts the slice size at each interval based on the signal direction. At each minute t, the algorithm first computes the baseline quantity required to complete the order on time given remaining inventory:
bt = remaining units / remaining intervals
The executed quantity is then adjusted according to the signal:
qt = bt (1 + λ st)
where st ∈ {−1, 0, +1} represents the signal direction relative to the order side, and λ is an aggressiveness parameter. In this benchmark, λ = 1. When the signal is favorable, execution is accelerated relative to the neutral trajectory; when unfavorable, it is slowed.
To prevent excessive inventory accumulation, a guardrail is applied: if bt exceeds twice the initial TWAP slice size q₀=N/T, the signal is ignored and execution reverts to the neutral pace qt=bt. This ensures the strategy never defers too aggressively and can always complete the full parent order by the session close.
A second guardrail prevents execution from tapering to sub-TWAP pace late in the session: if bt falls below q₀, the executed quantity is floored at q₀ for the remainder of the session, ensuring a smooth completion without anomalous slowdown at the close.
3.4 Example
Setup:
- Buy Order
- Q = 1,000 units
- T = 10 intervals
- q₀ = N/T = 100 units
- λ = 1
guardrail triggers if bt> 2 × q₀ = 200 units
Table 1: Signal aware execution example with signal values
| t | Signal | Decision | st | bt | qt | vs q0 | Executed | Remaining | Progress |
|---|---|---|---|---|---|---|---|---|---|
| 1 | UP ↑ | Accelerate | +1 | 100.0 | 200.0 | +100.0 | 200.0 | 800.0 | 20% |
| 2 | UP ↑ | Accelerate | +1 | 88.9 | 177.8 | +77.8 | 177.8 | 622.2 | 38% |
| 3 | DOWN ↓ | Pause | −1 | 77.8 | 0.0 | -100.0 | 0.0 | 622.2 | 38% |
| 4 | DOWN ↓ | Pause | −1 | 88.9 | 0.0 | -100.0 | 0.0 | 622.2 | 38% |
| 5 | DOWN ↓ | Pause | −1 | 103.7 | 0.0 | -100.0 | 0.0 | 622.2 | 38% |
| 6 | DOWN ↓ | Pause | −1 | 124.4 | 0.0 | -100.0 | 0.0 | 622.2 | 38% |
| 7 | DOWN ↓ | Pause | −1 | 155.6 | 0.0 | -100.0 | 0.0 | 622.2 | 38% |
| 8 | DOWN ↓ | Guardrail | −1 | 207.4 | 207.4 | +107.4 | 207.4 | 414.8 | 59% |
| 9 | UP ↑ | Guardrail | +1 | 207.4 | 207.4 | +107.4 | 207.4 | 207.4 | 79% |
| 10 | UP ↑ | Guardrail | +1 | 207.4 | 207.4 | +107.4 | 207.4 | 0.0 | 100% |
What to note: Five consecutive DOWN signals (t3–t7) cause execution to pause entirely, letting inventory accumulate. By t8 the catch-up pace bt = 622/3 ≈ 207 units — exceeding the guardrail threshold of 2 × q₀ = 200. The guardrail overrides the signal at t8 and t9, forcing execution at the neutral catch-up pace regardless of signal direction. This ensures the full order completes by t10 without aggressive end-of-session trading. Total executed: 1,000 units across all 10 intervals.
4. Performance Metric
Performance is measured using implementation shortfall relative to the session open price. For a sell order on day d, shortfall is defined as:
ISd = (Average Execution Price − Open Price) / Open Price × 10,000
expressed in basis points. For a buy order, the sign is reversed:
ISd = (Open Price − Average Execution Price) / Open Price × 10,000
Under this convention, a more negative IS indicates worse execution — the strategy bought above the open (for buys) or sold below the open (for sells) — while a more positive IS indicates better execution. In both cases, the signal-aware strategy improves execution by shifting the trajectory toward more favorable prices: accelerating when price is expected to move against the order, and slowing when it is expected to move in a favorable direction.
The daily improvement relative to each benchmark is defined as:
Δd(TWAP) = ISd(Signal Strategy) − ISd(TWAP)
Δd(VWAP) = ISd(Signal Strategy) − ISd(VWAP)
where ISd(VWAP) is computed by replacing the average execution price with the session market VWAP in the same IS formula. A positive Δd means the signal-aware schedule achieved better execution than the respective benchmark on that day, regardless of the sign of IS itself. Both improvement metrics are directly comparable across instruments and order directions.
5. Annual Reports Summary
Table 1: 2025
| Symbol | Direction | TWAP IS (bps) | VWAP IS (bps) | QS IS (bps) | Improvement vs TWAP (bps) | Improvement vs VWAP (bps) |
|---|---|---|---|---|---|---|
| ES | Buy | -1.0926 | 0.4195 | 0.8948 | 1.9874 | 0.4753 |
| ES | Sell | 1.0926 | -0.4195 | 3.5691 | 2.4765 | 3.9886 |
| NQ | Buy | -0.0966 | 2.1019 | 3.2678 | 3.3644 | 1.1659 |
| NQ | Sell | 0.0966 | -2.1019 | 3.767 | 3.6704 | 5.8689 |
Table 2: 2024
| Symbol | Direction | TWAP IS (bps) | VWAP IS (bps) | QS IS (bps) | Improvement vs TWAP (bps) | Improvement vs VWAP (bps) |
|---|---|---|---|---|---|---|
| ES | Buy | -0.25 | 1.3682 | 1.3594 | 1.6094 | -0.0088 |
| ES | Sell | 0.25 | -1.3682 | 2.2848 | 2.0348 | 3.6530 |
| NQ | Buy | 1.1422 | 3.3306 | 3.5701 | 2.4279 | 0.2395 |
| NQ | Sell | -1.1422 | -3.3306 | 1.7172 | 2.8593 | 5.0478 |
6. Interpretation
The signal-aware schedule outperforms TWAP across all 32 quarter-symbol-direction combinations, with an average daily improvement of 2.58 basis points. The result is entirely consistent — positive in every quarter, for both instruments and both order directions — suggesting a systematic execution edge rather than a period-specific effect.
The magnitude of improvement versus TWAP varies with market conditions, ranging from 0.07 to 9.80 basis points across the 32 quarters. This variation is expected for a timing-based strategy: in periods of stronger intraday directional persistence, the signal shifts the execution trajectory more meaningfully, while in quieter periods the improvement is more modest. Crucially, the strategy never underperforms TWAP in any quarter — the guardrail mechanism ensures execution pace never falls so far behind the neutral schedule that aggressive catch-up trading is required.
NQ shows consistently larger improvements than ES, averaging 3.1 bps versus 2.0 bps annually. This holds against both benchmarks and is consistent with NQ exhibiting stronger intraday directional dynamics, which the model is better positioned to exploit for timing purposes.
Against the theoretical market VWAP benchmark, the signal-aware schedule outperforms by the same average of 2.58 basis points per day — the convergence of the two averages reflecting the close alignment of time-weighted and volume-weighted prices for liquid index futures over annual horizons. Note that market VWAP is an ex-post statistic no live algorithm can replicate, and real broker VWAP implementations typically fall short due to volume forecast error and execution friction, meaning the practical edge over live VWAP strategies is likely wider still. The improvement versus VWAP is directionally asymmetric: on sell orders, the average outperformance is 4.66 basis points with no negative quarter across all 16 short-side combinations; on buy orders, the average is 0.49 basis points, with 8 of 16 quarters modestly negative — quarters in which market VWAP proved more favorable than the signal-aware schedule. This asymmetry reflects equity index microstructure: downside moves are sharper and more persistent intraday, giving the signal greater timing leverage on the sell side.
The benchmark does not attempt to replicate a full broker execution stack. It isolates the value of predictive timing while keeping total traded quantity and execution horizon identical across scenarios. Given the slice sizes relative to the liquidity of ES and NQ, market impact beyond the zero-cost assumption is considered negligible. The results suggest that direction-to-close signals can serve as an effective timing overlay on top of standard execution schedules, with applicability extending to correlated instruments such as MES, MNQ, SPY, and QQQ.
7. Quarterly breakdown
Table 3: 2025
| Symbol | Direction | Quarter | TWAP IS (bps) | VWAP IS (bps) | QS IS (bps) | Improvement vs TWAP (bps) | Improvement vs VWAP (bps) |
|---|---|---|---|---|---|---|---|
| ES | Buy | Q1 | 7.241 | 8.6762 | 8.3181 | 1.0771 | -0.3582 |
| Q2 | -14.5771 | -13.7119 | -9.2668 | 5.3103 | 4.4451 | ||
| Q3 | -0.6109 | 0.5906 | 0.9691 | 1.58 | 0.3785 | ||
| Q4 | 3.4006 | 5.9343 | 3.4709 | 0.0703 | -2.4633 | ||
| Sell | Q1 | -7.241 | -8.6762 | -6.1855 | 1.0555 | 2.4907 | |
| Q2 | 14.5771 | 13.7119 | 21.5547 | 6.9776 | 7.8428 | ||
| Q3 | 0.6109 | -0.5906 | 2.4897 | 1.8788 | 3.0803 | ||
| Q4 | -3.4006 | -5.9343 | -3.2916 | 0.1091 | 2.6427 | ||
| NQ | Buy | Q1 | 13.3732 | 14.7858 | 15.9834 | 2.6102 | 1.1976 |
| Q2 | -22.0547 | -19.0755 | -13.6744 | 8.3803 | 5.4011 | ||
| Q3 | -0.0042 | 1.9491 | 1.5186 | 1.5229 | -0.4305 | ||
| Q4 | 8.0312 | 10.4876 | 9.1662 | 1.135 | -1.3214 | ||
| Sell | Q1 | -13.3732 | -14.7858 | -11.0966 | 2.2766 | 3.6892 | |
| Q2 | 22.0547 | 19.0755 | 31.8518 | 9.7971 | 12.7763 | ||
| Q3 | 0.0042 | -1.9491 | 1.5098 | 1.5056 | 3.459 | ||
| Q4 | -8.0312 | -10.4876 | -6.7134 | 1.3178 | 3.7742 |
Table 4: 2024
| Symbol | Direction | Quarter | TWAP IS (bps) | VWAP IS (bps) | QS IS (bps) | Improvement vs TWAP (bps) | Improvement vs VWAP (bps) |
|---|---|---|---|---|---|---|---|
| ES | Buy | Q1 | -4.9794 | -4.5843 | -2.7883 | 2.1911 | 1.796 |
| Q2 | 1.4474 | 3.048 | 2.7503 | 1.3029 | -0.2977 | ||
| Q3 | 3.3026 | 4.2143 | 6.1561 | 2.8535 | 1.9417 | ||
| Q4 | -0.9708 | 2.5677 | -0.8818 | 0.0889 | -3.4495 | ||
| Sell | Q1 | 4.9794 | 4.5843 | 7.7919 | 2.8125 | 3.2076 | |
| Q2 | -1.4474 | -3.048 | 0.0474 | 1.4948 | 3.0954 | ||
| Q3 | -3.3026 | -4.2143 | 0.2435 | 3.5461 | 4.4578 | ||
| Q4 | 0.9708 | -2.5677 | 1.2572 | 0.2865 | 3.8249 | ||
| NQ | Buy | Q1 | -1.0362 | 0.3541 | 2.6737 | 3.7098 | 2.3196 |
| Q2 | -1.3023 | 0.9307 | 0.2437 | 1.546 | -0.687 | ||
| Q3 | 8.1462 | 9.1352 | 10.9347 | 2.7885 | 1.7995 | ||
| Q4 | -1.4138 | 2.7216 | 0.2874 | 1.7012 | -2.4342 | ||
| Sell | Q1 | 1.0362 | -0.3541 | 5.4008 | 4.3646 | 5.7549 | |
| Q2 | 1.3023 | -0.9307 | 2.8158 | 1.5135 | 3.7465 | ||
| Q3 | -8.1462 | -9.1352 | -4.7277 | 3.4185 | 4.4075 | ||
| Q4 | 1.4138 | -2.7216 | 3.5923 | 2.1785 | 6.3139 |