Summary: We established an initial benchmark to evaluate mid-price prediction models using Nasdaq order book data, replicating state-of-the-art methodologies from a key research study. By designing a scalable AI pipeline and testing leading models, we validated our approach and set the stage for further experimentation with larger datasets and custom models in AI and quantum-driven trading.
Objective
As we kick off our product development, our initial objective is to establish a baseline for mid-price prediction using order book data. This benchmark serves three primary purposes:
- Assess Value and Utility: By engaging with traders and portfolio managers, we aim to understand the real-world value of mid-price predictions derived from order book data.
- Design an Efficient AI Pipeline: Our goal is to create a modular and scalable AI pipeline that allows rapid iteration on data handling, distributed AI model training, signal generation, and visualization.
- Experiment with Data and Models: We will test data feeds from multiple exchanges, replicate state-of-the-art time-series prediction models, and benchmark their performance on publicly available datasets.
Methodology
Our benchmarking approach is inspired by the paper, LOB-Based Deep Learning Models for Stock PriceTrend Prediction: A Benchmark Study, authored by AI researchers from JP Morgan Chase and Sapienza University of Rome. This study examines various state-of-the-art models, training them on historical data to evaluate their prediction accuracy. We aim to replicate their methodologies, validate these models, and establish our own benchmarks.
Data
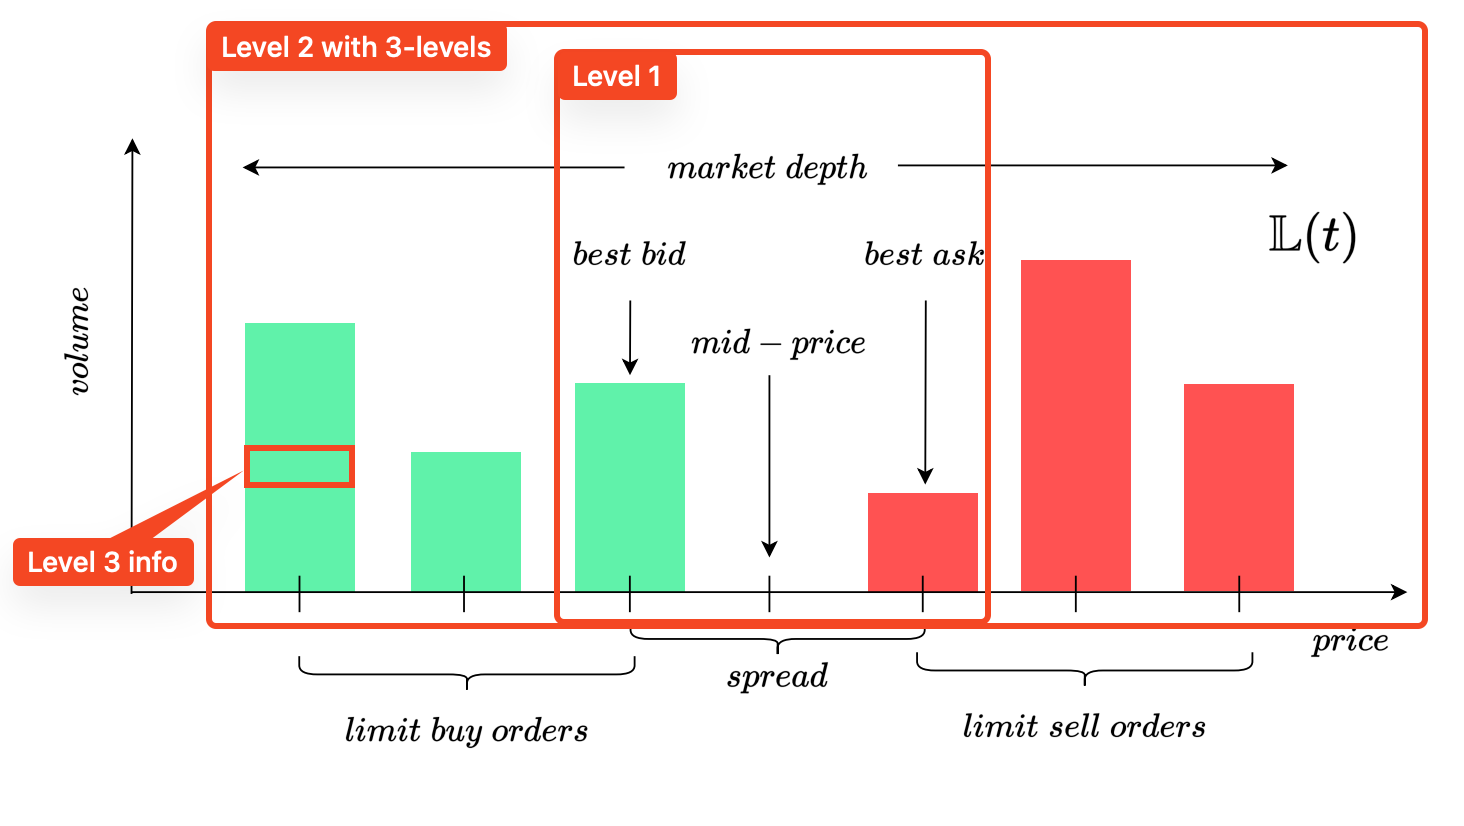
Consistent with the referenced study, we utilize Level 2 limit order book (LOB) data from Nasdaq. This data, which can be sourced directly from exchanges or data vendors, often includes historical records spanning a decade or more. For our initial benchmark, we use 10 price-volume levels of Level 2 data.
- Level 1 LOB shows the best buy (bid) and sell (ask) prices, including their volumes.
- Level 2 LOB displays multiple price levels with corresponding order volumes, such as a "5-level" depth (showing the top 5 buy and lowest 5 sell prices) or deeper levels like the 10-level used in our benchmark.
- Level 3 LOB adds individual order identifiers on top of Level 2 data, breaking down each price level into individual order volumes.
Pre-processing this data correctly is crucial and involves several steps that we will explore in future posts.
M. Prata et al (https://arxiv.org/pdf/2308.01915)
For this benchmark, we analyze LOB data from two timeframes:
- Feb 2022 (2022-02-01 to 2022-02-15)
- July 2021 (2021-07-01 to 2021-07-15)
We also examine data from six stocks:
- SoFi Technologies (SOFI),
- Netflix (NFLX),
- Cisco Systems (CSCO),
- Wing Stop (WING),
- Shoals Technologies Group (SHLS),
- Landstar System (LSTR)
Models
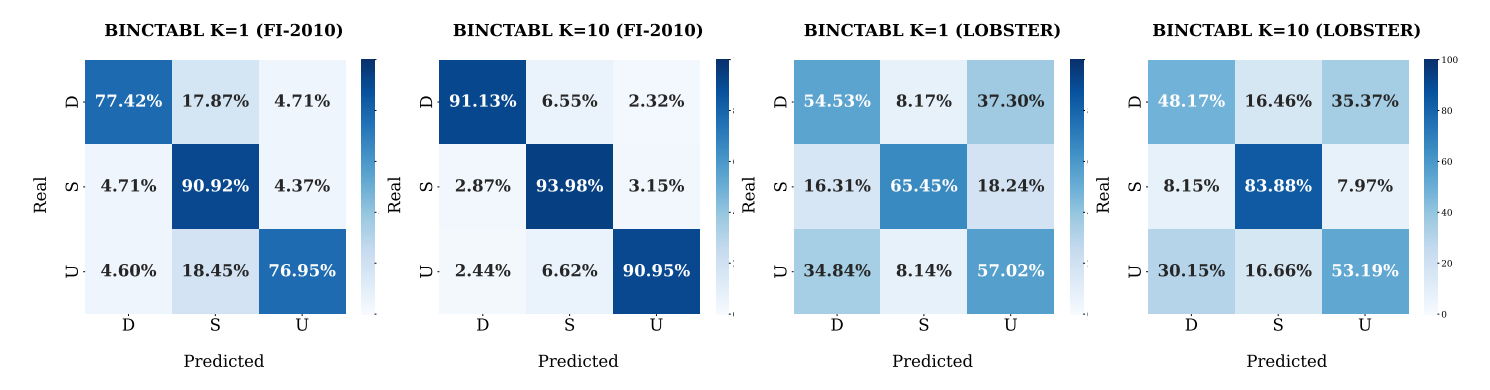
We implemented several leading models from the benchmark study, including BINCTABL, which was the top performer.

Signals
The models are trained to predict whether the mid-price of a stock will move up, down, or stay the same over a short prediction horizon of 1 to 10 "events." Here, an event refers to any change in the order book’s structure, such as a new order, cancellation, or execution. For instance, a new limit order from a buyer or seller indicates an intent to trade a specific stock at a given price, impacting the order book shape. During active trading periods, these events can occur in rapid succession, sometimes within fractions of a second.
We will delve deeper into the implications of prediction horizons and event handling in upcoming posts.
Initial Results and Conclusions
Our AI pipeline delivered as anticipated, successfully replicating the benchmark study results, including those of BINCTABL, the leading model. This confirms the strength and reliability of our pipeline in training models and validating prediction accuracy.
Achieving this first milestone has provided us with a scalable and adaptable AI framework, paving the way for future experiments with larger datasets, new model innovations, and parameter optimizations. We’re excited to continue advancing in the realm of AI and quantum-driven trading—stay tuned for future updates and sign up for our newsletter to keep track of our progress.